Activity Monitor is a great utility on the Mac to monitor what applications and services are chewing up CPU cycles, energy hogs, and other things that might slow your Mac down. in this tutorial, I’ll show you how to engage a version of Activity Monitor to track your iOS device. My particular interest in using Instruments was to see if I could figure out why my iPhone was chewing up battery while it was asleep. With Instruments I was able to monitor my device and it’s processes while it was sleeping.
Prerequisite: Download and install Xcode first from the Mac App Store: https://itunes.apple.com/us/app/xcode/id497799835?mt=12
Note that this download is more than 2GB.
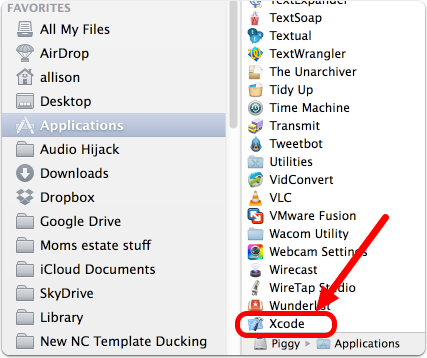
Xcode in Applications
After installation, Xcode will bei n your Applications folder as shown.
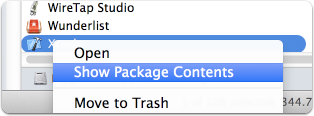
Open Package Contents
Xcode is actually a package that includes other applications. To reveal these secret files, right click on Xcode and choose Show Package Contents.
Connect Your iOS Device to Your Mac
Make a physical connection via a cable to your Mac from your iOS device.
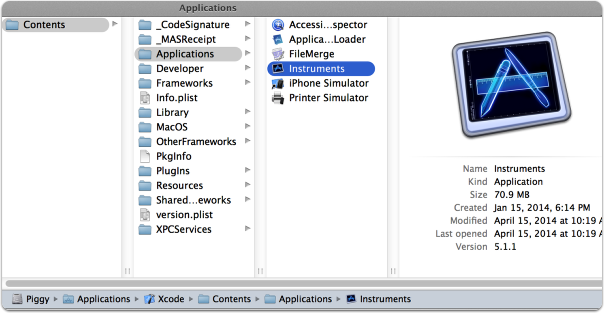
Navigate to Instruments
Navigate to Contents/Applications/Instruments
You can now launch Instruments as as standalone document. You might want to put it in your Dock, or left sidebar for the future.
Once you have launched Instruments for the first time, you can alternatively launch Instruments directly from Spotlight.
Instruments
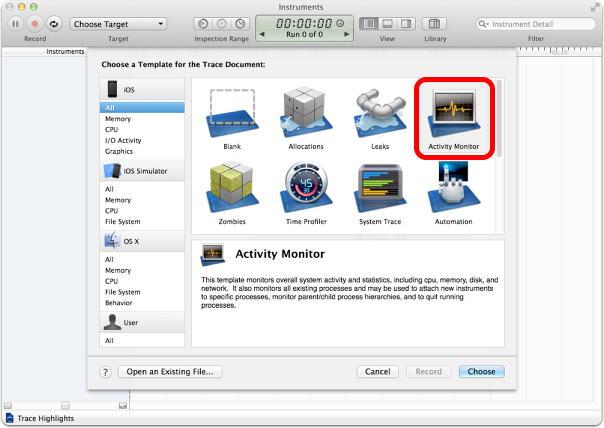
You’re faced with several templates, or you can begin building your own. For this exercise we’ll open the Activity Monitor template.
Instruments Main Screen
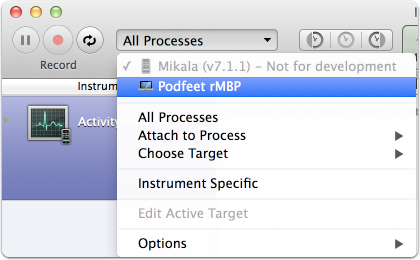
Change All Processes to Select Your iOS Device
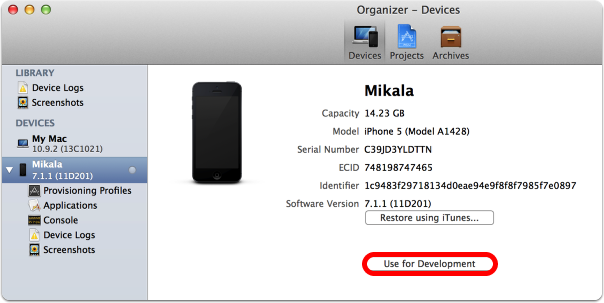
My iPhone’s name is Mikala, but you can see that it’s greyed out with the warning "Not for development". So we need to go declare the device to be used for development.
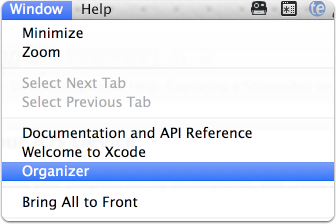
Launch Xcode Itself
Open Window –> Organizer
Xcode Organizer
Choose your device in the left sidebar and select Use for Development.
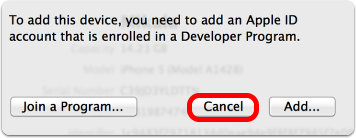
Uh oh
You’ll see the window but don’t panic, simply tap Cancel, and then quit Xcode.
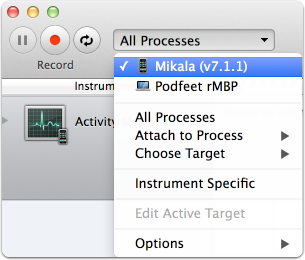
Now Select Your iOS Device in Instruments
If all went well in the previous step, you should now be able to select your iOS device under All Processes
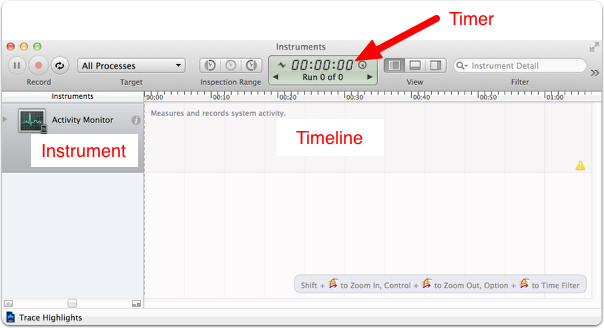
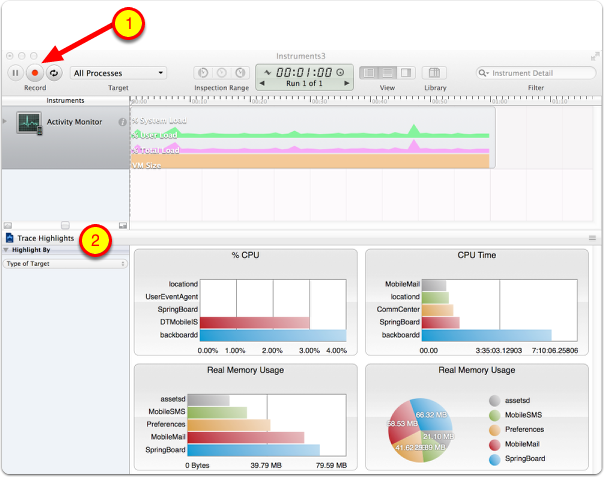
Hit Record!
As you begin your recording, you can see a real time graph of the activity on your device, along with bar graphs for % CPU, CPU Time, Real Memory Usage, and then Real Memory Usage as a pie chart.
For more data, tap on Trace Highlights in the left sidebar, and it will change to say Activity Monitor.
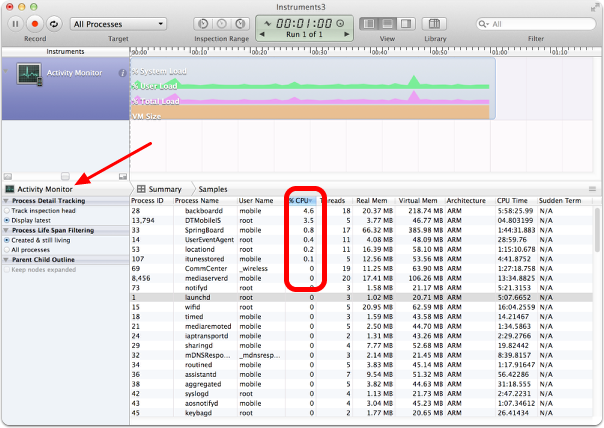
Instruments3
All kinds of cool goodness in here. Now you can use the headings to sort by say %CPU to see what applications are hogging up all of your cycles.
Note that you can make multiple runs to compare them and you can even save the instrument for later viewing.
I’ll leave you to experiment with Instruments to see what else you can learn about your device.