
Mermaid Diagrams Won’t Replace Diagrams.net as my diagramming tool of choice, but they’re still pretty cool.
I’ve been having a lot of fun lately with a tool called Mermaid for making diagrams. I’ve hesitated about whether to tell you about Mermaid diagrams for two reasons. One reason for my hesitance is that they’re a pretty nerdy way to make diagrams that’s a lot harder than using my beloved Diagrams.net. The other reason is that Bart already taught us a bit about Mermaid in Programming By Stealth installment 141.
Bart’s instructions were how to make UML Class diagrams in Mermaid, which are made specifically for programming. We’ll be using UML Class diagrams in the project to port XKPasswd to a modern JavaScript version. His instructions did everything from the command line in the terminal, which is great for a programming audience, but I wanted to see if I could teach Mermaid diagrams in a way that normal people could do it.
I’ve discovered that there is a far less nerdy way to create Mermaid diagrams that I might talk you into trying, and an example of a type of diagram you might want to make — a simple flowchart.
How Does Mermaid Work?
I first learned about Mermaid diagrams back when I reviewed the note-taking app Joplin a year or so ago. In my description, I said, “I learned just enough to be impressed and amazed that Mermaid exists, then practiced a little bit inside Joplin, and learned that this is too nerdy for even me.” I pride myself on becoming nerdier every year, and after having Bart walk us through the UML Class diagram example, I got the itch to try them again and they’re simpler than I realized.
Let’s talk about why Mermaid is nerdy. Instead of dragging and dropping boxes and lines onto a canvas through a graphical user interface, you create diagrams using only a plain text file.
For example, if you’re drawing a flow chart and you want a rectangular box with text in it, you just type the text between square brackets. If you want the box to have rounded corners, use round brackets instead: [some text] or (some text)
Want a line with an arrowhead between two boxes? Simply type two dashes and a right angle bracket: -->. That’s not too hard, right?
What’s the Problem to Be Solved
But what problem does it solve to use Mermaid text files for diagramming instead of a GUI? There are a couple of advantages that may or may not be compelling for you, but with any luck, you’ll enjoy learning about them even if you never use them “in anger” yourself.
Plain text files are easier to share between people who need to collaborate. If I create a nifty diagram in a GUI, I’ll usually export it to an image file before sharing it. There’s no way for you to edit my graphic file. To collaborate, I’d have to convince you to get an account on the same service I’m using, and the service would have to support sharing. Using a text file for collaboration means you and I can use any text editor we want and any file-sharing service to do the collaboration.
In Programming By Stealth, we’ve learned about using version control for our code. That lets people keep copies of the same code all over the place – on their own machines, and online with services such as GitHub, or BitBucket. When one person changes the code, the changes can be pushed around to the other copies, and yet the changes are tracked so if mistakes are made (or I should say when mistakes are made), they can be reversed. If I create a diagram in a text file, we can put it in version control and collaborate more easily. That’s nerd-level stuff though, so let’s get back to mainstream needs.
If a Mermaid diagram is well-written, it could actually be an accessible form of the graphical image. A PNG image file embedded on a website would be pretty hard to describe fully in Alt-text. Having a link to the Mermaid text file might be a good alternative.
Finally, text files are way way way smaller than pretty much any other file type. The diagram I made for the Programming By Stealth project has seven boxes on it, it has cute little icons in it, some boxes are round, some square, they’re different colors, and I have solid and dashed lines. The entire file is 1KB. I’m not joking. One whole kilobyte.
Apps that Support Mermaid
In Programming By Stealth, Bart taught us how to install Mermaid using something called Node JS, all from the command line. This adds a giant folder of modules to the folder where you create the diagrams. He taught us to create the text file for the diagrams in any text editor, but then we had to run Mermaid from the command line.
We had to tell Mermaid where to find the input text file, and what to call the output PNG image file. It takes a few seconds to run, and then we’re able to double-click on the PNG to open it and see if it looks like what we were hoping for.
All of this is perfectly normal in programming world.
It works, but to be honest, it’s a tedious process. I was delighted to find out that there are text editors out there that will allow you to create your diagrams and see them changing in real-time as you’re typing.
Mermaid has a terrific user manual: About Mermaid | Mermaid, and one section is all about tools that have integrated Mermaid diagrams Integrations | Mermaid. There are pages and pages of tools, but I wanted to focus specifically on text editors.
A few of the tools listed have native support for Mermaid, meaning you don’t need to install any plugins or extensions. Apps we’ve mentioned on the NosillaCast before and include native support for Mermaid include Joplin, Notion, and Al’s favorite, Obsidian. They all have free versions. There’s also a website called Mermaid Live where you can create your masterpiece diagram. The Mermaid Live editor is a great place to learn the tool but as my father would have said, “It’s ugly as sin”. Pick any one of these tools and you can play along with this very basic introductory lesson on making Mermaid diagrams.
Enough About the Tools – How to Diagram with Mermaid
Enough about the tools. Let’s get into the meat of how to write in Mermaid to create diagrams. The documentation on Mermaid is superb. They start you really slow and then add on more and more concepts to enhance your diagrams.
Let’s just build up a simple flowchart and see how far we can get. Let’s make a diagram to explain the different shows at the Podfeet Podcasts. We’ll create a box at the top that says Podfeet Podcasts, then three boxes below that for NosillaCast, Chit Chat Across the Pond, and Taming the Terminal. Below Chit Chat Across the Pond, we need two more boxes for Chit Chat Across the Pond Lite and Programming By Stealth. Once we get those basic blocks in place, we can start having some fun styling our diagrams.

The first thing to type into your text editor is the type of diagram you want. Mermaid can create a lot of different diagram types, including flowcharts, Gantt, Pie Charts, Mindmaps, and more. We need to tell Mermaid we’re going to create a flowchart, and we need to tell it whether we want it to go left/right or top/down. Since we want ours top/down, we simply type:
flowchart TD
We want Podfeet Podcasts in a square box at the top, so we’ll put Podfeet Podcasts between square brackets. Every node you create in a diagram has to have an ID, but we can make that ID any name we like (without spaces). I like short names because they’re easier to type, so I’ll call this first node PP. There’s the added bonus that saying PP out loud makes me giggle because I have the maturity of a seven-year-old. We need to put the name PP cuddled up against the node name in its brackets. Putting this together we make our first node with PP[Podfeet Podcasts].
flowchart TD
PP[Podfeet Podcasts]
As soon as I enter those two simple lines of text, I’m rewarded with a rectangular box that says Podfeet Podcasts inside it.
Well that didn’t hurt too much, did it?
If I type NC[NosillaCast] on a new line, I get a second node but it gets drawn side-by-side with the first Podfeet Podcasts node. That’s because I haven’t yet told Mermaid about the relationship between these two nodes.
On the second line, before it says NC, I can put --> and this instantly drops the NosillaCast down, and now we have a lovely diagram with Podfeet Podcasts in a box with an arrowed line going down to NosillaCast.

In literally 3 lines of text, we have drawn a diagram. This feels really powerful to me!
So we have Podfeet Podcasts above NosillaCast with an arrow going down, but we need three arrows going down to three boxes. Since all of these nodes should be below Podfeet Podcasts, we type them on the same line as the NosillaCast node with an ampersand between them. The text says: “arrow NosillaCast & Chit Chat Across the Pond & Taming the Terminal”. We now see the three podcasts in rectangular boxes below Podfeet Podcasts with lovely arrows going to them.

This is starting to look pretty good now, but the boxes are getting super wide because Mermaid doesn’t automatically word-wrap text. We need to add some line breaks in our nodes. In HTML, the way you insert a line break is with the text “br” between two angle brackets: <br> and we can actually use that same syntax within Mermaid diagrams.

With some well-placed breaks, the diagram looks much better, but the text in Mermaid is definitely starting to look messy. Building it up piece by piece like this helps us to understand it, but at first glance, it looks a bit like a cat just walked across your keyboard. We’ll clean it up in a moment to make it more readable.
For our final piece of content, we want to add Chit Chat Across the Pond Lite and Programming By Stealth below Chit Chat Across the Pond with arrows going down to them.
We could, if we hated ourselves, embed those last two blocks in the line we just created with NosillaCast and Chit Chat Across the Pond, but there’s an easier way. Once you’ve created a node, you can just reference it again by its ID name, e.g. NC or TTT.
In fact, as I was writing this up I did some experiments and learned that we can make everything look much simpler. Think of each node as a variable you’ve assigned. The variable name NC has the value of NosillaCast, and the variable CCATPL has the value of Chit Chat Across the Pond Lite.
We can define each of these variables (nodes) on their own simple-looking line with no information about their relationships. Then later in the file we can write the relationships using the variable names which will look much cleaner.
Node definitions:
PP[Podfeet Podcasts]
NC[NosillaCast]
CCATP[Chit Chat Across<br>the Pond]
TTT[Taming the<br>Terminal]
CCATPL[Chit Chat Across<br>the Pond Lite]
PBS[Programming<br>By Stealth]
Now the relationships are clean and easy to read:
PP
  --> NC & CCATP & TTT
  CCATP --> CCATPL & PBS
That’s a LOT easier to read and way fewer cat steps on the keyboard!

I hope you are experiencing the joy I felt as I learned more about how to do this. That’s why I think it’s so fun.
Styling Mermaid Diagrams
We now have our full relationship diagram created in a few lines of text, but to be honest it’s kind of boring. We can add some styling to the boxes for our nodes. To each individual node, we could add text to define the text color, fill color, and more, but there’s a cleaner way than doing it on every node. We can define classes with that information and then add the class name to the nodes.
The way you define a class is with the word classDef followed by the name you choose for the class and then the colors.
Let’s define a class called “top” and we’ll make the text white with the fill color red.
classDef top color:white, fill:red
And then we assign the class “top” to our top node PP by:
class PP top
These two lines can sit anywhere in your diagram text that you like. I prefer them at the bottom. The advantage of assigning classes isn’t obvious when you only have one node with the class. But now that we know how to create and assign classes, we can assign the same color and fill to the rest of the nodes.
I added one more class called podcasts and declared that they should be color:white (the text color) and filled with blue. You can then add the class to multiple nodes in one line by typing class followed by each node name separated by commas, and then the name of the classDef.
classDef podcasts color:white, fill:blue
class NC, CCATP, TTT, CCATPL, PBS podcasts
Now my text file has 3 sections:
- A listing of the variable names for each node
- The 3 lines that create the diagram with the arrows
- The section that defines the classes and assigns those attributes to the nodes
My diagram now has Podfeet Podcasts in red with white letters and all of the other nodes are blue with white text. It’s really rather pretty now.

I’m pretty happy with the diagram so far but I’d like to have a way to make the propeller beanie shows (Taming the Terminal and Programming By Stealth) have a different shape.
I mentioned at the beginning that putting the text of the node inside square brackets makes sharp-cornered rectangles, and round brackets made them rounded rectangles. There are a lot more shapes you can easily designate by changing those brackets.
I don’t bother remembering how to do fancy things like this in Mermaid, because I can always refer to the terrific user manual for Mermaid About Mermaid | Mermaid. In the left sidebar, you can see the different types of diagrams you can make, and if you select flowchart, now the right sidebar shows you the different sections. I keep this open as a reference, so now I can select Node Shapes to find a better shape.
I wanted to find a shape that looked nerdy so I could assign it to the Taming the Terminal and Programming By Stealth podcasts. One of the options is called a subroutine box, which is just a rectangle with an extra vertical line on the right and left. You make those with double square brackets around your node. That’s a little nerdy.
Ooh, how about a box that has a kind of pointy edge on either side like an elongated hexagon? They call this a code box and you make that using two squirrelly brackets on either side of your node. I think green would be a nice color for them. I created another class called nerds and assigned it to Taming the Terminal and Programming By Stealth. Instantly I had green nerdy boxes for the two nerd podcasts.

One thing that can make your nodes stand out even more is to add Font Awesome icons. While this is possible, the developer of the app or service you’re using to create your Mermaid Diagrams has to enable it, and Mermaid only supports Font Awesome 4 and 5 (not version 6). Creating Mermaid diagrams from the command line does let you put the cute little icons in, but none of the easy-to-use text editors I tested support it so we’ll have to abandon it for this lesson.
There’s a LOT more you can do with Mermaid diagrams but let’s just do one more fun thing. Let’s change the way the arrowed line looks that goes to our two nerd podcast nodes. We’ve been using the syntax --> to designate a line with an arrowhead. We can make that a dotted line by sticking a dot between the two dashes ( -.-> )instead.
We have to rearrange the relationship lines a smidge to get the dotted line to go just from PP to TTT, which makes the text a tad longer, but still super readable.
We can make the line designation even more interesting by adding some text to the dotted lines for the nerd podcasts. Instead of -.-> we can interrupt that by putting text between two dots: -.Nerds.->.
This was looking snazzy, but I wasn’t happy with how the lines curved on my diagram by default. I found a section in the manual on styling line curves. Warning: this will look like the nerdiest part of your diagram.
To change the default styling of your lines in Mermaid, you put an initialization line at the top in which you can describe the default curve shape. I tried out the different options from the manual, and a “linear” shape looked the best to me. Instead of wide, swoopy curves, the diagram now has diagonal lines with a sharp turn downward, and the word “Nerds” sits nicely at the corner.
%%{ init: { 'flowchart': { 'curve': 'linear' } } }%%

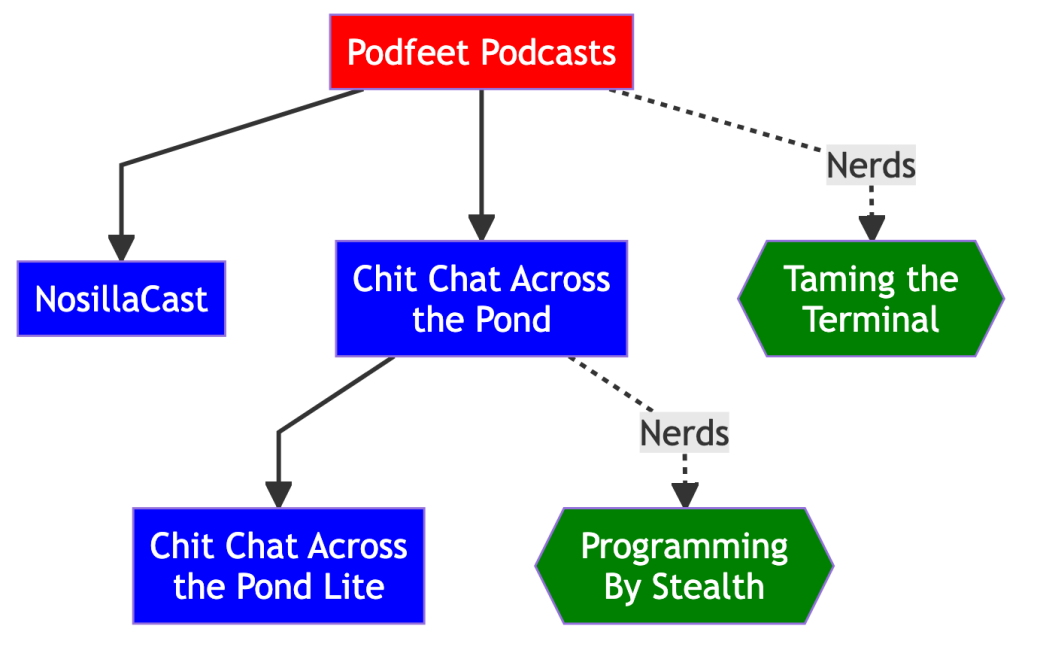
I had to stop here because I could keep tweaking this diagram all day and learning more and more cool things I could do with Mermaid. My final masterpiece is a grand total of 26 lines and it’s actually human readable.
%%{ init: { 'flowchart': { 'curve': 'linear' } } }%%

flowchart TD

    PP[Podfeet Podcasts]
    NC[NosillaCast]
    CCATP[Chit Chat Across<br>the Pond]
    TTT{{Taming the<br>Terminal}}
    CCATPL[Chit Chat Across<br>the Pond Lite]
    PBS{{Programming<br>By Stealth}}

    PP
        --> NC & CCATP
        CCATP --> CCATPL
        CCATP -.Nerds.-> PBS
    PP
        -.Nerds.-> TTT

classDef top color:white, fill:red
classDef podcasts color:white, fill:blue
classDef nerds color:white, fill:green

class PP top
class NC,CCATP,CCATPL podcasts
class TTT,PBS nerds
You can do a whole lot more with Mermaid than I’ve described here, but as I said, I have to stop! Hopefully what I’ve explained tickles your interest to go play with it and see what it can do to help you make fun, interesting diagrams in plain text.
But Wait, What Can I DO with a Mermaid Diagram
I tried to get off easy and just wrap up this article thinking you might not notice that I didn’t tell you what you can actually do with a Mermaid Diagram after you create it. But it bothered me that I didn’t know the answer to the question myself. You can see your pretty diagram in your text editor of choice, but how do you share it with someone? Ideally I’d like to be able to send someone a PNG image file.
If you’re a nerd, there are a lot of options. Both GitLab and GitHub have integrated Mermaid diagrams into their services. This makes a lot of sense because having version control on plain text files is the whole reason for these services. Version control on image files isn’t as practical because you have to just keep recreating and replacing the images. Since Mermaid diagrams are text files, they’re purpose-built to work with Git.
But the whole point of this article was to teach the less-nerdery amongst us how to make Mermaid diagrams, so we need a simpler Muggle-level way to actually publish a graphic image of a Mermaid diagram.
The obvious solution is to simply export the graphic image from one of the text editor tools I mentioned. Or so you would think. Let’s walk through a few of the options I tried.
Obsidian Export
Obsidian is a bit weird for my tastes with this concept of vaults and I often ended up in a condition where I couldn’t open my files, but when it was in a good mood it worked well to create Mermaid diagrams and view them graphically.

While Obsidian won’t let you export as a PNG, it will let you export to PDF. If you open the PDF in Preview, you can then save it as a PNG. From there you can then crop the giant white canvas Obisidan gives you down to just the diagram. While that’s an annoying two-step process, the good news is that the resolution is really good so you can expand it to be pretty big. Mine came out at 1472 × 945 pixels and looked great.
Notion Export
Notion worked well too to create Mermaid diagrams and even has a specific integration for them. But for the life of me, I could not find any way whatsoever to export the image file in any format at all. If anyone can figure out how the heck to get Mermaid diagrams out of Notion, I’m all ears.

Notion is marketed as a collaboration tool, so maybe Mermaid diagrams captive inside the tool could still be useful for teams. I prefer tools that let you import and export data.
Joplin Export
Joplin, like Obsidian, allows you to export PDFs, so we have to do the same dance to save as a PNG, and then crop a giant white canvas down to the image. Again the good news is that the resulting image is pretty high resolution so this method does work. Still weird to not just be able to export to an image file, but that workaround does give the desired image.

VSCode Export
Nerds use a tool called VSCode by Microsoft to write code, and it actually works quite well for creating Mermaid diagrams even if you’re not a self-proclaimed nerd. That is if you install a plugin for visualization. The one I was using that nicely rendered my Markdown text worked perfectly.
But I couldn’t figure out how to export from VSCode. I tested a few more plugins that were supposed to allow the user to export the graphic, but I couldn’t get them to work. Even worse, they disabled the Markdown-rendering plugin I was using originally. I’ve now messed my plugins all up and so I’ve got to do some cleanup to get back to where I started!
Mermaid Live Export – a Quest
And now for a diversion that will eventually answer the question of how you can easily export Mermaid diagrams to a PNG.
As I was fussing around with all of this, I posted a question on Mastodon asking what people actually do with Mermaid diagrams, and it resulted in a fun new friendship with a gentleman named Ed Ross (@[email protected]).
Ed and I exchanged around 20 messages about Mermaid and did a whole bunch of experiments together. The funny part is that Ed had never seen Mermaid diagrams before we started but he quickly descended into my madness. He learned them on the fly as we were chatting and ended up down a whole new path.
ChapGPT Diversion
Ed decided to try using ChatGPT to create Mermaid diagrams. ChatGPT is an OpenAI tool that allows you to ask questions in text, and using its data set from scraping all openly accessible data on the web, it develops an answer. ChatGPT is often wrong because humans are often wrong and humans have written the content in its dataset. But ChatGPT can be a useful tool if you know how to vet the information it provides you.
For example, Ed asked it to create a Mermaid diagram to show the relationships of the Simpsons family and it created a correct representation. I tried to replicate Ed’s experiment, but the output from my ChatGPT query return the wrong syntax. It used 2 dashes instead of 3 to draw the lines so it threw errors till I fixed it. My second attempt was to ask ChatGPT to create a Mermaid diagram demonstrating the relationships between the three branches of the US government and not only was the diagram correct, but the paragraph of text that came along with it was also correct. Like I said, it’s important to vet whatever you get out of ChatGPT.
Back to Mermaid Live
While Ed and I had fun playing with this, Ed suggested I go back and give the Mermaid Live editor another try. You may remember that at the start of this article, I said I tried it but it was “ugly as sin”. I had also tried to get it to export an image file, but it didn’t work. On Ed’s advice, I switched from Safari to Microsoft Edge, which is a Chromium browser, and then the export function did work to save a PNG. (I could have sworn I tried that but the evidence does not support me.)
You’d think I would declare victory at this point because I did technically get a PNG on export, but it was wee tiny and barely readable. Mermaid Live editor does provide a scaling option for PNGs where you can set it to a specific width or height, but it doesn’t work intelligently at all.
I changed the width to 2000px wide, but instead of enlarging the PNG, it enlarged the white canvas background, effectively shrinking the PNG even smaller. I was really feeling like Mermaid diagrams were just mocking me at this point. How does anyone export a PNG in one darn step?
Ed didn’t give up on me and suggested I try the SVG export option. SVG stands for Scalable Vector Graphic, which is an ideal format because you can scale vectors to any size you like. You do have to use a vector editor and then save it to a PNG, but it could give you the best image quality. I tried the SVG export button in the Mermaid Live editor, and then tried to open the file in Affinity Designer, my favorite vector editor. The resulting graphic was a bunch of solid black boxes! I was baffled by this.

Thinking it was some misunderstanding between standards for SVG definitions, I tried opening it in the very good and free Vectornator application but again I got the same black boxes.
By this time any sane person would have given up, but I’m like a dog with a bone when I see a solution just out of my grasp. There had to be a good way to export Mermaid diagrams as high-quality PNGs. I posted the problem in Slack and Allister Jenks had a good idea. He suggested that maybe the SVG was actually ok. He suggested as a test, that I just drag the SVG onto my browser window. He said if the file wasn’t damaged in some way, it should open the graphic. Sure enough, it opened in all its glory right in my browser!
I used command-+ to increase the size of the graphic, and then just took a darn screenshot of the browser window. Not elegant but for a relatively small and uncomplicated diagram, it finally worked.
Diagrams.net Export
I said at the beginning that Mermaid diagrams won’t take the place of my beloved Diagrams.net. But then I discovered that it has support for Mermaid diagrams! It’s not hard to make them in Diagrams.net but it’s not at all obvious how to do it. Under the Arrange menu, you’ll find an option to Insert, and at the bottom of that menu you’ll find an Advanced menu, and in that menu you’ll find Mermaid. It’s only one click to get there but I’m sure I’ll have to look it up every time I want to do it.
This pops open a little text field where you can type or paste your code, and when you hit OK, you’ll see your lovely diagram. To edit the diagram, simply double-click on the image in Diagrams.net, and you get the text box where you can change the text and when you hit Apply you’ll see your changes. The text box is pretty small so I’m not sure I’d want to do my initial creation of a Mermaid diagram in Diagrams.net.

There’s a huge advantage to rendering your Mermaid diagrams in Diagrams.net. They’re vector-based diagrams. This means that when you choose File → Export and choose PNG, you can type in a scaling factor and the PNG is actually scaled perfectly! Finally, I’ve come full circle from my favorite diagramming tool to my favorite diagramming tool.
Not only that, Diagrams.net’s file format is XML, which is a plain text format, so the Mermaid diagrams I create within Diagrams.net can be put in version control. But that got me to thinking … if all Diagrams.net files are in text-based XML format, couldn’t I create my diagrams with the native tools and use Git to do version control on them? Well that’s a thought for another day.
Bottom Line
The bottom line is that I was hoping to show you how fun it is to make diagrams using Mermaid and that even for the non-super-geeks it can be fun and pretty easy. I’m pretty sure that in the end, by giving you 12 different ways to export the diagrams, I may have turned you off from the whole idea. But maybe you can find one of those ways that brings you joy.