Ron Heiby wrote a “dumb question” in our slack (at podfeet.com/slack):
Just listening to the “In a Few Minutes” episode from Feb 14 and heard you mention about using Airtable for tracking the streaming stuff you have in-process. I know almost nothing about Airtable, having just looked at their web site’s main page a bit. I’m not understanding what it is about Airtable for this use case that would not be handled equally as well by a Google Sheets spreadsheet. What is better about Airtable for tracking that?
I put this in the Dumb Question category because it was the exact same question I had for years and years. I was too embarrassed to ask because everyone else seemed to see this epic difference between a spreadsheet and a database, but I couldn’t see it.
It actually wasn’t until I started using Airtable that I finally grokked the power that a database can give you. Now don’t get me wrong, databases won’t necessarily replace spreadsheets in your life, because who doesn’t love a good pivot table? I see each tool as having its own purposes and problems they solve.
With a spreadsheet, you have what are essentially flat files. You may have a link from one sheet to another for an equation, but there’s no fundamental relationship between them. With a relational database, there are relationships between the types of data.
Let’s use my TV watching database as a set of problems to be solved. My husband Steve and I watch some TV shows together, but we also have shows that we only watch alone. The TV programs we watch are on all different networks, and we can never seem to keep track of which one is on what network. We have a bad habit of forgetting that we’re watching a series and then stumble across it much later, having entirely lost track of the plot.
Another problem we have is remembering if a series is still actively being produced or if it’s maybe on hiatus, or perhaps we’ve watched the entire series. We wanted a way to slice and dice the data of what we’re watching by these different parameters. It would be nice, for example, to be able to see at a glance whether we’re still watching anything on a specific network, thereby letting us know if we could cancel our subscription.
We were getting stressed out by all these problems, and when watching TV is stressing you out, you know you’re doing it wrong!
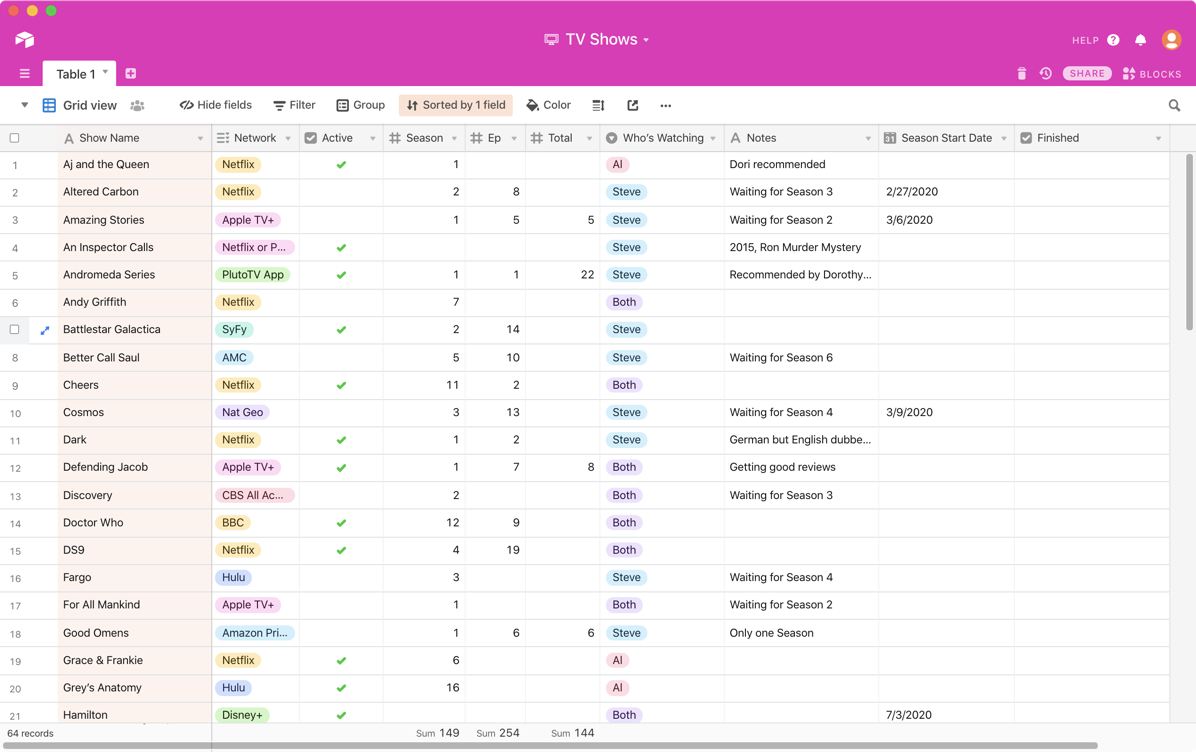
In Airtable I started by creating what looks like a spreadsheet, using what Airtable calls Grid View. Down the left column, we put the show name. Then we added columns for the network on which it’s airing, who’s watching, whether it’s active and whether we’ve finished watching it.
If this was a spreadsheet, we could fill in each column and we’d have a nice chart of all the shows with all the information we needed.
Now let’s walk through a use-case scenario. Steve sits down to watch TV while I’m upstairs obsessively coding for my Programming By Stealth homework. He wants to watch something that we’re not watching together. In order to easily find just his shows in the spreadsheet, he has a couple of options.
His first option would be to select the top row, and add a filter, and set the “Who’s Watching” column to Steve. Then he could filter out the shows that are designated as Finished. This would work perfectly for him, but when I opened the spreadsheet and all of my data would be missing. I’d have to change the filters to make it look the way I wanted it, thereby messing it up for him.
Alternatively, he could sort by “who’s watching”. My stuff would be at the top alphabetically and his below that. However, when a show was completed, it would still be sitting in that list, and the list would get longer and longer. We’d have to copy the row for that program to another sheet called Finished. And yes, of course, we’d want to keep tracking what we’d finished because it would be just like us to start up a program thinking we hadn’t seen it yet, only to start saying, “Wait…this seems familiar.”
And what if later we add a column to the spreadsheet for genres, such as sci-fi vs. romantic comedy. Each of us could start with the mood we’re in for a show? How would that sort get messed up with two people changing the same spreadsheet?
Steve could also make a pivot table that showed just the data he wanted to see and not mess up the original spreadsheet, but the last time I checked, pivot tables don’t update automatically so even more confusion would probably ensue.
Now let’s see how a relational database can solve this problem elegantly and simply. The main thing that databases have that spreadsheets don’t is the concept of a view. Views are just what it says on the tin, they allow you to view the same live data in different ways. You can rearrange everything to your heart’s content in a specific view and not break any other views. At the same time, if you want to change the values while in a view and it affects the values in all views. In our example, if you mark a program as finished when in one view, that program will be shown as finished in all views.
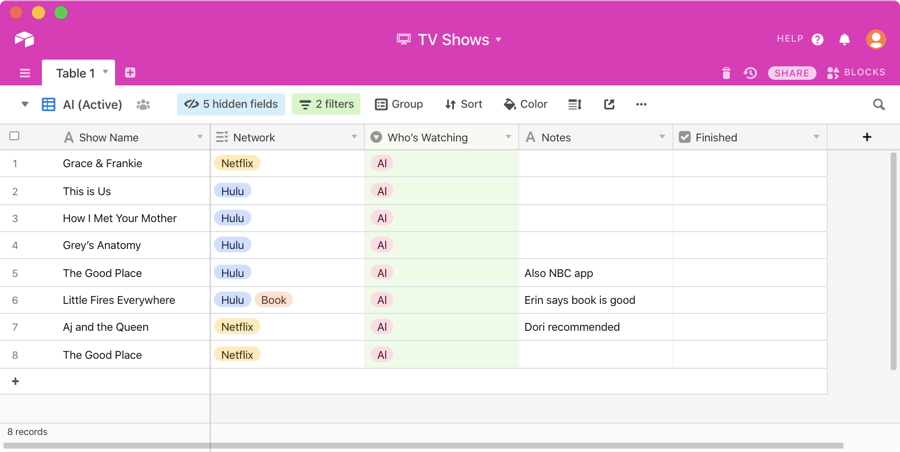
In our TV watching example, I was able to create a view called Steve, Allison, and both. In Steve’s view, it only presents the TV shows he’s currently watching that are active, and of course, mine presents the active shows I’m watching. But there’s even more benefit. Steve loves nothing more than adding more columns to a spreadsheet, and I like to keep a minimalist view. In the Steve active view, he can include the network, season number, episode number, total number of episodes, and a notes column of where he heard about it.
In my view, I’ve simply got the network, the column for who’s watching, and the notes column. We both have a view with exactly what we care about and nothing more, and yet neither of us is messing up the other’s view. We can even sort the columns at will without bothering the other person. There is peace in our land.
Another thing that I like about Airtable is that the columns don’t just contain words, numbers, or calculations. I chose a simple checkbox for the finished column, so there’s no need to type in “yes” or “no”. We set up a rule in the views we care about that says to only show programs where the finished checkbox is not selected. To be fair, you can in a Google Sheet add a checkbox and then a filter to choose whether to show the checked or unchecked rows.
I’ve been referring to rows and columns because that’s what they’re called in a spreadsheet, but in a database, the data in columns are called fields and the rows are called records. Airtable goes way beyond checkboxes for the format of the fields. In addition to single and multi-line text, a field can be an attachment, It can allow multiple selects and single selects, it can identify the collaborator, be a date, phone number, email, URL, number or currency. Airtable also color codes things very nicely.

For example in our single select field for who’s watching, the Steve entries are nice little blue bubbles, and because I like to annoy myself, those programs identified as just for me show Al inside a pink bubble, and the shows both of us watching have little purple bubbles.
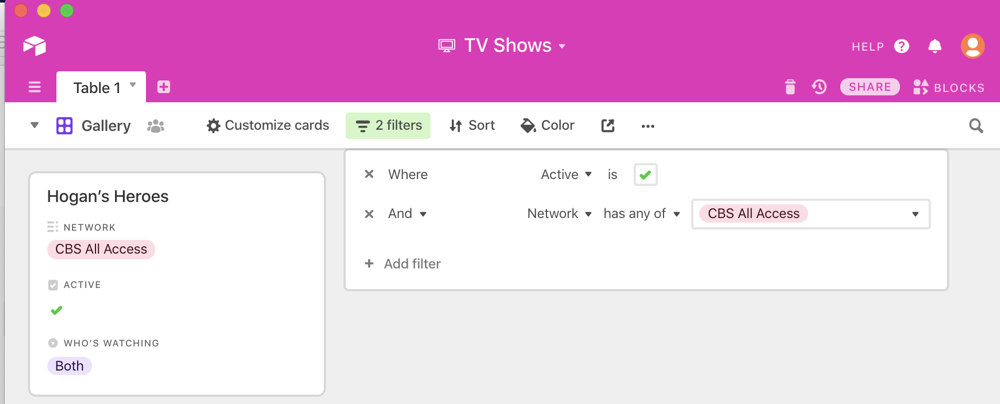
Since Steve and I were both raised on spreadsheets, we tend to have our views always in the grid format. But if you’re a little more adventurous, Airtable includes a Gallery view which shows you a little card for each entry. It’s playful and sometimes can trigger revelations about your data.
This week I was on our weekly video call with some friends and we got talking about TV shows we’re watching and networks we like. We got on the topic of Star Trek (as one does) and CBS All Access came up.
One of our friends asked why we’re still paying for CBS All Access when Picard and Discovery aren’t on right now. I pulled up my trusty Airtable, put it in Gallery view, set the filter to Network is CBS All Access, and to my dismay, I discovered that the only show that was active and we were watching was Hogan’s Heroes! I’m pretty sure I can do without that show for $10/month! See how useful a database is because of the flexibility of the views?
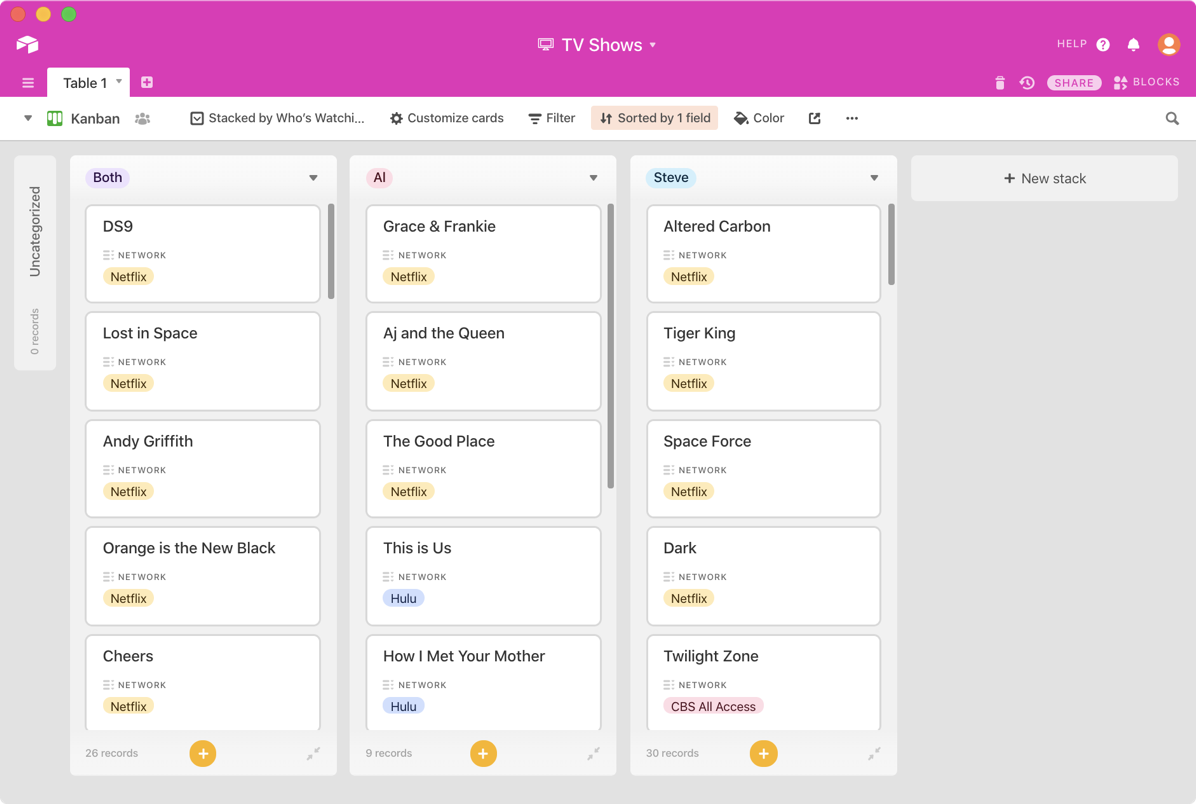
Another popular view is called Kanban. In Airtable I added a Kanban view and set the field for the view to be who’s watching. Instantly I had three columns of little cards representing the records: one for Both, one for Al and one for Steve. Each of these columns is called a stack and I can collapse them and even create new stacks.
I can change the stack sort to other fields, such as network and all columns re-sort themselves. By default, the Kanban cards only show the program name and the network, but in the Customize Cards menu I can turn on as many more fields as I like and the cards expand to show the newly-enabled information.
Trade Show Business Cards
I have another example of how a database can be more useful than a simple flat spreadsheet. When Steve and I go to trade shows, every person we interview gives us a business card. Each night, we go back to the hotel, and I transcribe all the information from the cards into a spreadsheet and add information about the product and any info that will trigger our memory of why we talked to each person.
As Steve works on his video production, he expands this spreadsheet to about 348 columns of information he needs to track. Ok, 348 might be a bit of an exaggeration, but it’s way more than I want to see. I care about maybe 4 columns total, and I have to scroll left and right like crazy to get to those columns I need. I can’t reorder the columns or it messes him up and I can’t hide them for the same reason. With an Airtable, I could have the view I want and he could have the view he wants.
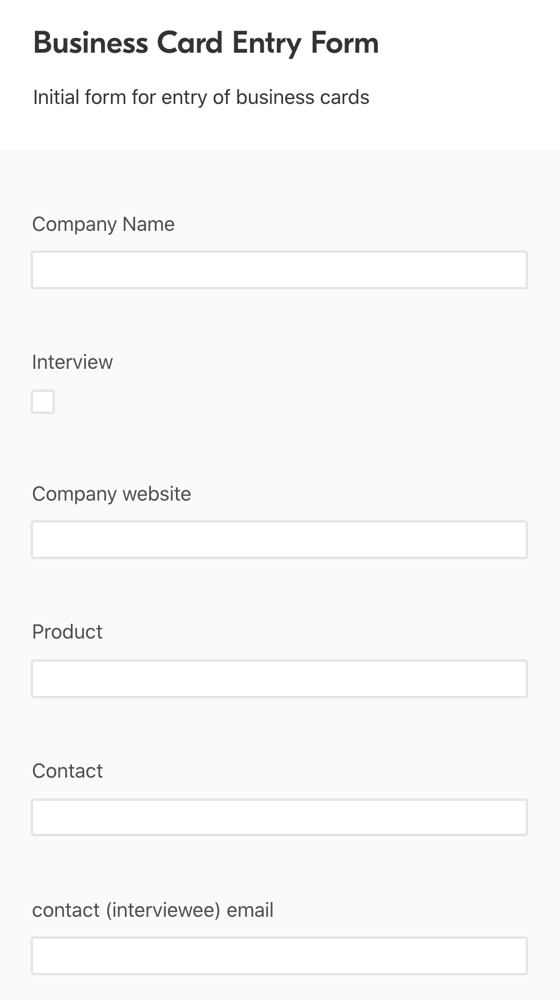
This is the same argument I used for why Airtable is the right tool for our TV watching solution. But for our trade show data, there was one more thing I love about Airtable that made the business card transcription ever so much easier than using a spreadsheet. With Airtable, you can create a web form to be filled out that automatically populates the database.
I created a form that had just the info I needed to transcribe from the business cards and nothing more, using the fields we have in our Airtable. I could pop open the link to the web form, and very quickly and efficiently enter the information from the business cards. I could do it on my Mac, iPhone, or iPad. As I added each business card, it populated the full Airtable database and none of Steve’s precious fields were moved or modified in any way.
If you’ve got a database you want populated by other people, you can create this kind of web form and have anyone fill it out without giving them access to the database itself. Having this form changed the transcription task at trade shows from a slog and a chore to just slightly annoying, but more importantly, allowed me to do the task much more quickly than working with a spreadsheet.
Bottom Line
I sent this explanation to Ron to have him verify if it made sense and the response was pretty funny. Turns out he knows what a database is and why they’re cool, but just didn’t realize at first glance that Airtable was a database! Then Ron took things up a notch and very creatively constructed a Google Sheet that successfully replicated much of what I use Airtable for with watching TV. You can view his spreadsheet in all its glory at docs.google.com/…
I still like Airtable better for the task, but it turns out you can use a hammer to turn a screw if you try hard enough.


I like your view (see what I did there) I would like to add, a db gets to its full strength when managing large volumes of data..