
Over the past decade, it has been getting hotter and hotter each summer where Steve and I live. We kept thinking that it was an aberration, but the weather caused by climate change is affecting us along with everyone else. We talked about getting air conditioning, but it seemed like a bad idea. To burn dead dinosaurs to cool the house that was getting too hot because of too much burning of dead dinosaurs just didn’t make sense.
Last summer we decided that we could cool our house without making global warming worse if we installed solar panels. If you want to learn more about what we had installed and the decisions we made, I wrote it up last July in my article entitled Solar Comes to Casa Sheridan. In the article, I talked about our decision on whether or not to also have whole home batteries installed (like Tesla Powerwalls) at the same time.
I explained that because of the way our electric company works with the laws in the state of California, the grid performs some of the functions that a battery would. During the day we generate more energy from solar than we use, so the excess energy goes into the grid. At night, after the sun goes down, we take energy back out of the grid. If over the course of a year, we generate the same amount of energy as we consume, the electric company does not charge us anything beyond a nominal fee. This isn’t true for everyone in every state or country, but that’s how it works here.
Because of this, we could not figure out a financial justification for adding batteries to our house. The other reason you might want to add batteries to your home is to protect against power outages. Without batteries, we were not protected from power outages. However, we don’t live where there are dangerous storms that take down power lines, and we are lucky enough that we are not in the high fire danger regions of California. Many areas of the state have rolling brownouts for various reasons but they don’t affect us.
Over the past year, we have experienced several power outages, but they were always these one-off weird situations. For example, a woman hit a power pole with her car and took out several city blocks around us. The outages have been minor inconveniences so far. We still didn’t really see that we could justify installing batteries based on those infrequent events.
But We Did it Anyway
Of course, this article is about how we decided to install whole home batteries anyway.
When you put solar on your house that is also tied to the grid, at least where we live, you can’t power your house during an outage. To protect the safety of utility workers, the solar system is designed to automatically shut off so power can’t be sent back into the grid’s power lines. This means solar power is also not available in your home during outages. By combining batteries with solar energy generation, that restriction goes away and you can use solar and battery power if and when the grid goes down.
I’ll get into how all that works in a little bit (including one of my world-famous diagrams). But let’s back up first, and talk about the decisions we had to make in purchasing and installing our whole home batteries.
Decision Time – Enphase vs. Tesla
The first decision we had to make was what brand of batteries we wanted to have installed. The two choices we had from our supplier were Enphase, which would’ve matched the batteries to the same brand of power inverters installed with our solar panels. The other option was to have Tesla Powerwalls installed.
You might be saying to yourself, “Hey, I thought Tesla would only let you have Powerwalls if you bought your solar panels from them.” That was true for quite a while when they were in short supply but they’ve opened up a bit to some third-party solar installers. In fact, Elon Musk announced recently that they will begin to sell them direct to non-solar customers by the end of 2022.
We got lucky, in that the company that installed our solar panels was already an approved Tesla Powerwall installer. They bought up a bunch of them so they just happened to be available to us as we were making our decision on which batteries to buy.
The price was essentially the same for both brands of batteries, but they had different energy-storage capacities. The Enphase batteries can store 10 kWh of energy while the Tesla Powerwalls can store 13.5 kWh; that’s 35% more. Both brands are $10K per battery.
On top of the battery cost, you also have to pay for installation which includes wiring and installation of a smattering of other boxes to control the batteries. These include a gateway to manage the different types of power and various shutoff switches. You probably will need to have electrical panel work done as well. Just keep that in mind when you think about the cost of whole home battery acquisition.
There were some advantages to having the battery brand match the solar panel brand with Enphase, and they do use slightly newer technology than the Tesla Powerwalls. In the end, though, the significantly larger capacity of the Powerwalls won out. Like any kind of battery, you can’t run it down to zero, and having 35% more storage was significant.
Sizing Batteries
Steve and I are both engineers, so we figured it would be trivial for us to model our energy usage to decide how much energy we needed to store. This would tell us how many batteries we needed.
It turns out to be harder than we expected because you have to make a lot of assumptions.
A primary use case for the batteries is to give us power during an outage. We know how much energy we use in a typical day, having tracked it pretty closely for the last year. So let’s say we want to be protected from a 24-hour outage. But how much sun was there the day before? Is the battery full? And how much sun is there going to be on the day the power goes out? Is the power going to go out in the middle of the night or the middle of the day?
We did a lot of math and made a lot of equations and debated the various scenarios. In the end, we decided that we needed two Powerwalls since a combined 27 kWh of stored energy would fully power our home for 24 hours during most days of average usage. I would have preferred to show you a definitive equation of how to size batteries, but we were never able to create that.
In addition to providing us with power in an outage, we also wanted to mostly eliminate our reliance on the grid on a day-to-day basis. One Powerwall would have helped in an outage, but two might nearly eliminate any reliance on the grid. Being able to erase such a huge part of our carbon footprint was very attractive to us.
Which Circuits Go on Battery
Once we’d made the decision of what to buy, the installers explained that we needed to decide what circuits we would need to go on backup power in case of an outage. We were told that we would have a limited number of circuits we could put on battery power, and we wouldn’t be able to put the really high-power circuits on battery backup power.
The circuit for our electric oven is 240V/50A, as is our electric vehicle charger for our Tesla cars. The low-power circuits are the ones that are more like 120V/15-20A. Whole home batteries have limitations on how much instantaneous current they can provide, so the electric oven and the electric vehicle charger for our cars would not be able to be powered by the battery.
One surprise was that our HVAC could go on the battery. That’s because we luckily chose a variable-speed heat pump for our HVAC system. This means the AC or heater doesn’t immediately slam on at full speed with a big current spike, it has a more gradual rise in current. Also, our HVAC is on a 240V/40A circuit which the Powerwalls could handle.
How Does it Work?
Now that I’ve explained our battery decision and described how we split the circuits up, let’s talk about how the whole system works.
Rather than try to explain the entire system and how it works in one step, I’ll take it in bite-sized chunks. I’m going to give you four versions of my diagram, building it up in pieces so as not to overwhelm anyone.
I got a lot out of making this diagram because the more I worked on it, the more I understood the system. Steve and I also discovered through this process that things work even better than we expected.
Solar Priority: House, then Battery, then Grid
The first thing to understand is the priority order of what happens to the power generated by the solar panels.
- During the day, the solar panels power the house.
- As the sun gets higher, the solar panels will generate more than we are consuming. This excess energy will be used to refill the battery from the night before.
- When the battery is filled, any excess solar energy is sent into the grid.
- As the sun goes down and the solar energy is insufficient to power the house, the battery begins to help out and eventually is the sole supplier of power.
- If the battery gets low on stored energy during the night, the grid will begin to power the home.
- In the morning, the process starts all over again.
If it’s a good sunny day in the middle of summer where the sun is as high as possible, we generate far more energy than we need. The battery is filled to 100% pretty early in the day, and we begin donating energy to the grid. Not only are we grid-independent, we’re adding clean energy back.
If there’s a massive heatwave across all of California with record temperatures being broken every day for a week and a half, things aren’t quite so rosy. We hit 104°F last week, and we live near the beach! We were very happy that we recently put in air conditioning, but we could see that it dramatically slowed down how long it took for the battery to fill during the day. Because it remained really hot at night, our battery was depleted before the night was over and our house was unfortunately cooled from the grid. This was an extreme condition, and the weeks before and since that massive heatwave we’ve avoided taking energy from the grid.
One day during the massive heatwave, the State of California put out an emergency alert to our phones, much like the Amber Alerts if you know what those are. Your phone vibrates and rings and you get an alarming message across the screen. The alert begged us to cut back our power usage because the grid was nearing its breaking point and they would be forced to begin rolling blackouts if we didn’t help. In a rare show of unity for the good of all, Californians immediately responded and rolling blackouts were avoided. It was such a success story that it made the national news.
I’d like to say we were team players and dropped our energy usage, but since we weren’t drawing any energy from the grid at all, we sat in our cool house with smug smiles on our faces. Now that I think about it, we could have turned the temperature up and suffered a little bit so that we could put energy into the grid, but luckily that did not occur to me at the time.
The Tesla App
With Tesla Powerwalls, you can view and change the algorithm for how solar, batteries, and the grid are used to power your home. It’s all done through the Tesla app, the same one that controls our cars.
While we were deciding whether to go with Enphase or Tesla for our batteries, both our friend Jolly and our friend Marco showed us how the Tesla app explains the flow of energy from the different sources. I have to admit that the cool factor was one of the drivers in favor of Tesla for our batteries. Even though we have Enphase solar inverters, the Tesla app reports our solar generation exactly the same as it does for Jolly and Marco.
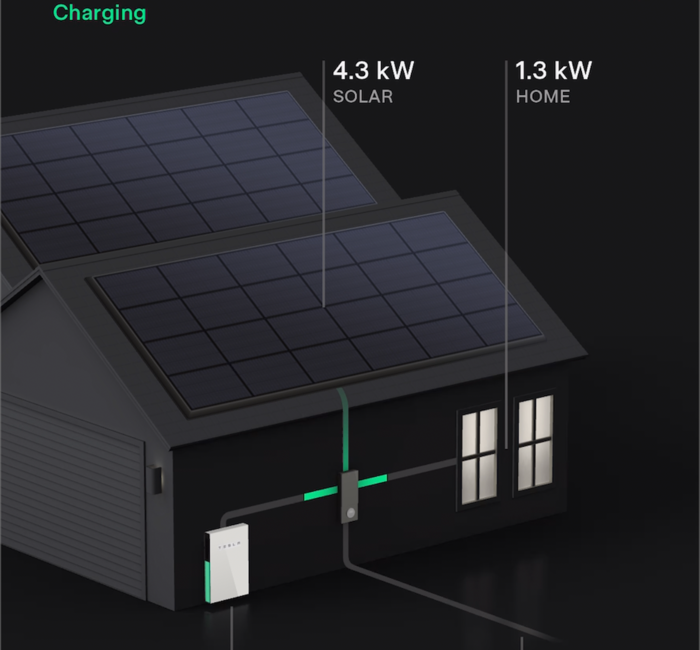
In the Tesla app, you get an animation of the way solar, battery and grid power flow to power your home. I embedded a video of this animation in the show notes so you can see how cool it is for yourself.
In the animation, at the top of the screen, it shows we were generating 4.3 kW of solar as of the time I took the video. Energy, represented by a pulsing green line, is flowing down from the solar panels towards a Tesla Gateway box. Then you see the green pulsing line split and go to the right to power the home, which was demanding 1.3 kW, with the remaining 3.0 kW flowing into the Powerwall(s) to the left. It also shows that the Powerwall(s) were 59% full at 10:21 AM.
It’s really fun to check this throughout the day and see the battery fill to 100% and the excess solar start going into the grid for someone else to use as clean energy instead of those dead dinosaurs.
I checked the Tesla app for accessibility using VoiceOver on iOS. Much of it is accessible, but the animation area is not. I get why the animation itself might not be accessible, but there’s no reason you shouldn’t be able to hear what the current solar, home, Powerwall, and grid values are at any moment in time. I tweeted this as an improvement suggestion to Tesla. I also “know a guy” at Tesla in a completely different organization and I’m going to see if I can squeeze a message through to the right people that way.
Settings for Batteries

I’ve described a few times how the Tesla Powerwall gets depleted after the sun goes down and gets refilled by the sun during the day. You have control over how depleted the batteries get before starting to pull from the grid. If the main reason you get whole home batteries is to protect from power outages, you probably don’t want your batteries to get too low overnight.
In Settings → Powerwall you have some interesting options to control the algorithm for battery usage. The first is a slider to simply control how low you allow your battery to go. In the screenshot I provided in the show notes, we currently have it set to reserve 35% for backup and 65% to power the house. This means that if we drain it to 35% during the night, we will begin to power the house via the grid instead of the battery until the sun comes up.
You also have granularity about when the Powerwall will power your house. In California (as well as other places in the U.S.), we have what are called Time of Use (TOU) plans. Energy is dramatically less expensive during off-peak hours, and very expensive (more than double) during peak hours. Those peak hours are when most people come home from work and begin using appliances from 5-8 or 4-9 PM depending on your plan.
Let’s say your solar panels don’t generate enough energy to both fill the battery and power the house all day long. You might want to rely on the grid during inexpensive times of the day but use your batteries to power the house during those super expensive 4-9 PM hours.
You tell the Tesla app which TOU plan you’re on, then choose Time-Based Control and it saves enough battery to be able to prioritize battery usage during those expensive times.
The second option is called Self-Powered. With this selected, after the sun goes down, the batteries will be used until they are depleted to the percentage you defined with the slider. We put in enough solar panels and bought 2 Powerwalls so that we can use the Self-powered option. We may have to mess with this setting during the winter if we have a lot of bad solar-production days in a row.
There’s another option on this screen for Grid Charging. Evidently, in some areas (not ours) you can actually use the grid to charge up your batteries. That’s the opposite of our objective but I can see why you might want to do that if you don’t have enough solar to fill your batteries.
Energy Graphs

The Tesla app also has a bunch of really nifty graphs. Who doesn’t love a good graph?
If you tap on Energy on the main page, the app tells you how much energy you’ve generated so far that day. I’m looking at it after a really good late-summer day with no clouds, and we generated 38.7 kWh of energy. If you tap on the Energy selection, you are treated to four graphs that show power consumed or produced from midnight to midnight for a given day. You can also swipe these graphs to look back day-by-day.
You can change the view for the graphs to week, month, year, or even lifetime. And at the bottom of every graph, you’re invited to download your data to have even more nerdy fun.
The first graph shows you the energy consumed for that time period. Below the graph, it tells you how much you consumed from your three sources: solar, Powerwall, and grid. They even give you a little horizontal stacked bar chart of those three sources by percentage.
The next graph is your solar generation and below that, you can see how much went to your home, how much into the Powerwall, and how much went back to the grid. Again, there’s a stacked bar chart by percentage.
The third graph is confusing at first; it’s the Powerwall discharge. It’s confusing because while you’re discharging energy to your home before the sun comes up and after it goes down, the graph goes above the zero line, meaning the battery was discharging. But when the sun comes up, and the Powerwall starts to be filled by the sun, the graph inverts and goes below zero. It’s like a double negative – it’s negative discharge, also known as positive charge. The page also includes a graph of the Powerwall’s state of charge throughout the day, from 0 to 100%.
The final graph shows how much grid power you consumed during the day. This one can also be confusing, especially if you flip back and forth with the battery discharge graph. If you consume power from the grid, the graph goes above zero, but if you shove electrons back into the grid from your solar, then it’s below zero.
I took screenshots of our four graphs on a sunny day and stacked them one above the other to help this all make sense. It really demonstrates how the system works. You can see the sun coming up on the solar power generation graph, and that starts to make the battery discharge graph go into the negative (charging) state. But around noon, the battery discharge graph essentially stops reporting anything at all. You can see by the grid power consumption graph that since the battery is now full, all of the excess solar started pumping into the grid. I truly did have trouble interpreting these graphs until I saw them stacked together like this.
Happy Surprise
I mentioned early on that we discovered that our system performs even better than we expected.
Remember I explained that we couldn’t put the oven and the EV charger onto the battery circuit? We misinterpreted what that meant. We assumed that the oven and EV charger would always draw energy from the grid. Imagine our surprise and delight when we watched the energy graphs and discovered that the oven and EV charger both drew from the battery.
Now how could that be?
This is when I decided to diagram the whole thing because I needed to learn how it worked. The final diagram has a lot of information on it, so I moved things to different layers so I could build it up slowly for you so as not to scare you away.
The first layer shows you just the components of the system. At the top, you’ll see the solar panels and the solar combiner that takes the energy from the two separate banks of panels we have. You’ll also see a cute icon representing the grid.
You’ll see the main electrical panel for the oven and EV charger, and a sub-electrical panel for everything else in the home. At the bottom, we’ve got the two Tesla Powerwalls that act as one.
The interesting part of this diagram is the little traffic cop icon in the middle. This icon represents the Tesla Backup Gateway. This is the brains of the outfit. The Gateway is in charge of routing the energy from the three sources – solar, battery, and grid – and makes sure to use solar first to power the home, then fill the batteries, and finally to give back to the grid. The Gateway also controls what happens when solar and battery are not available to power the home and brings in grid power. It has one more job, and that’s to route power appropriately when the grid goes down.

In the next version of the diagram, you’ll now see grid power as dashed red lines. You can see the energy coming from the grid and into the main electrical panel. If there isn’t enough solar or battery, power flows from the grid into the EV charger and oven when required.
From the main electrical panel, you can see the dashed red lines going to the Tesla Backup Gateway to ask for directions from the traffic cop.

Given the appropriate directions from the Gateway (not enough solar or battery), grid power will flow to the sub-electrical panel and power the home.
So far that’s pretty simple. Now let’s look focus on just solar/battery power flow layer.
I decided to represent clean energy in the diagram with solid green lines. Solar and battery power are then both designated as green. At the top, we start at the solar panels which shows two green lines flowing into the Solar Combiner. The energy goes into the Tesla Backup Gateway (the traffic cop).
Depending on the directions from the Gateway, solar energy flows into the battery to refill it as necessary, and sends solar and battery power to the sub-electrical panel and then into the home. Whether the grid is up or down, this energy path will be there.
If the grid is up, green energy will flow in additional paths. I decided to designate this “if the grid is up” flow with dashed green lines.
If the Gateway senses that the grid is up, the solar/battery power is allowed to flow to the main electrical panel to power the EV charger and oven. This is the path that surprised and delighted us.
Finally, if the battery is full and there is excess solar power beyond our consumption, the Gateway will send that excess clean energy back to the grid.

The last version of my diagram has all of the layers turned on so you can see green solar and battery power flowing around, along with dirty, nasty red lines representing the grid power.

Bottom Line
Steve and I understand our solar/battery flow so much better because I decided to try to explain it to you. The diagram was essential to our understanding. There were a lot of iterations of the diagram and even beta testing with our friends Bill and Diane to see if it conveyed the correct information. I want to thank Steve for his initial explanations, and continued tweaks as he followed the wires on our system and studied the wiring diagram from our installer.
The bottom line is that we absolutely love our new batteries. We feel really good about making our contribution to lowering greenhouse gasses in the future.
And finally, the irony of the story is that we paid for two 13.5 kWh batteries when we have two 75 kWh batteries parked in the garage.